
February 26, 2024
A while ago, a group of us went to the jsDay/phpDay conference in Verona. There were a lot of different talks, but the one called ‘Dancing with Robots’ by Julian Cheal really caught my attention.
Mr. Cheal presented an ‘Internet of Things’ based idea in front of a live audience. That kind of thing somehow never turns out great and is mostly riddled with a bunch of ‘I just need to log in to this thing’ pauses that result in a massive decrease in attention.
But this was different, this guy had a table full of stuff – LEDs, LCDs, Arduinos, drones, Raspberries, Spheros and sensors, and they were all connected to something, somewhere.
Don’t get me wrong, it’s not that everything he displayed worked — from the depressing ‘fly drone, fly!!!’ during which most of the people thought they’ll get killed or at least injured, yet the drone didn’t even respond, to massive connection issues which resulted in Cheal dancing and prancing in an attempt (a very successful one, if we might add) to keep the audience’s attention. Anyway, Cheal is a guy that can demonstrate the power of IoT even if nothing works, and he can really motivate you to make something interesting.
At the end of his talk, he tried to present and demonstrate as many gadgets as he could. One of them was an MQ-3 alcohol sensor. That was the thing that caught our attention (we like beer). We immediately started thinking about implementing such an interesting piece of data into something amazing.
The other thing that intrigued us was the cylon.js library, but more on that later.
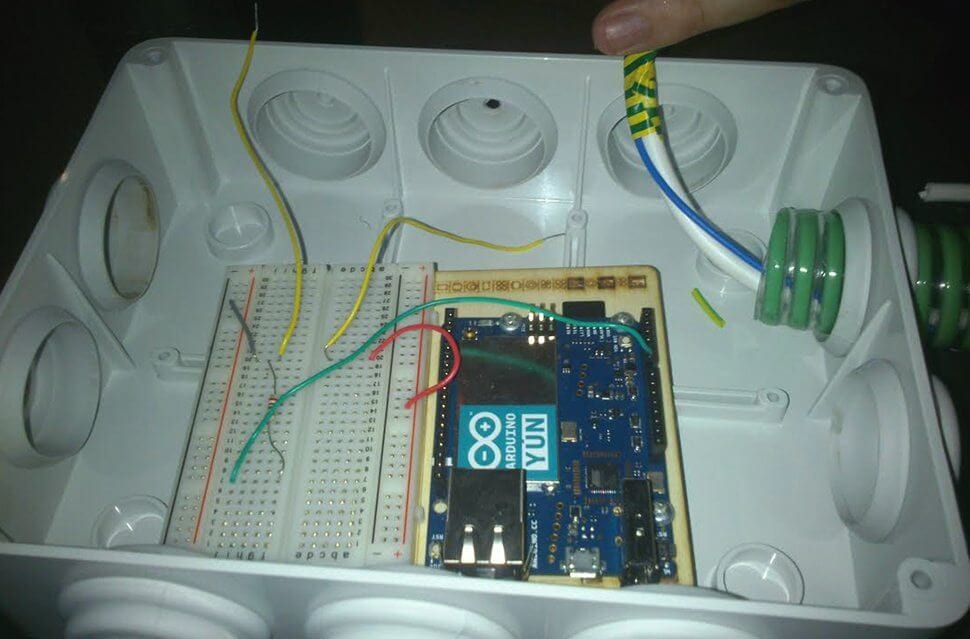
We bought an Arduino Yun for the office quite a while ago, just to play around with it and see how it works and what can be done with it. After all, IoT is on the rise and we have to be ready!
We managed to write some messages on the LCD, make some LEDs flash and some motors to spin, but nothing extremely ‘fun’ and ‘playable’ popped into our minds.
Cue the MQ-3!
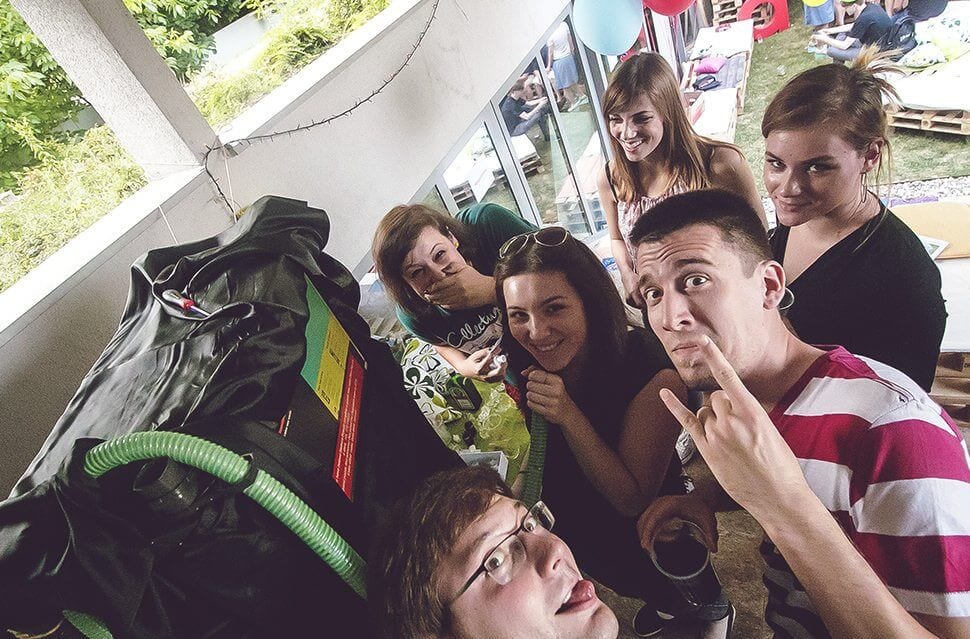
In Degordian, we really like to hang out and party together. And where there’s a party, there are also drinks, and that’s about all we can say without making Degordian sound like an AA meeting! As it turned out, our company’s birthday, also known as the biggest party of the year, was just around the corner, and then it hit us.
We are going to make some kind of alco-data based thingamajig that has some kind of statistics and calculations that people on the party could use!
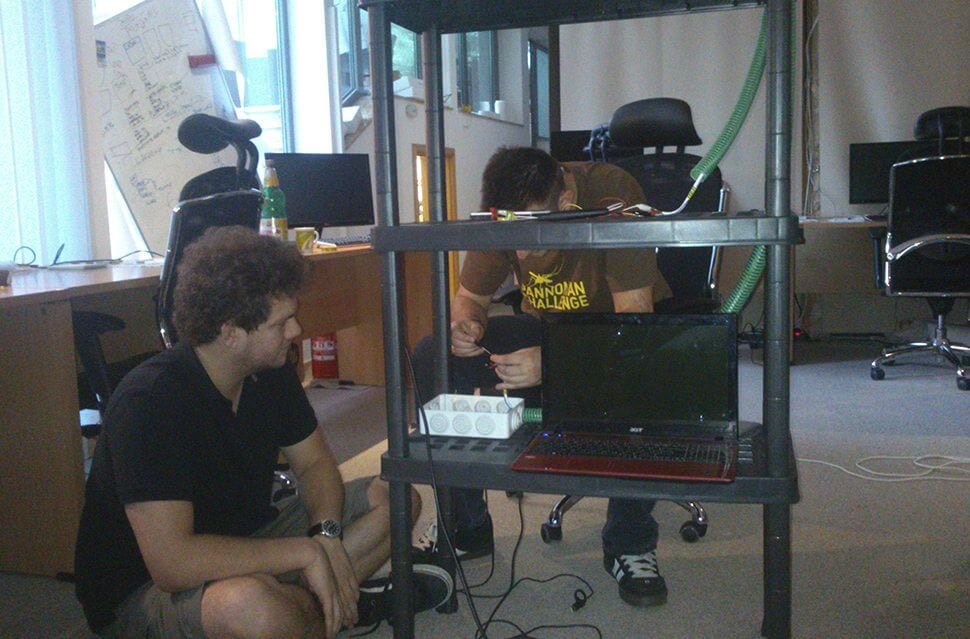
The first step was to actually get our hands on some MQ-3’s. And if you’re from Croatia, you’ll probably have a hard time finding them anywhere. We found ours on Sparkfun.com (shipping to Croatia took 6 weeks, just saying). Wiring it to the Arduino is not complicated because it’s basically just a potentiometer with a heater. All you need is 5V, a resistor and about 6 wires.
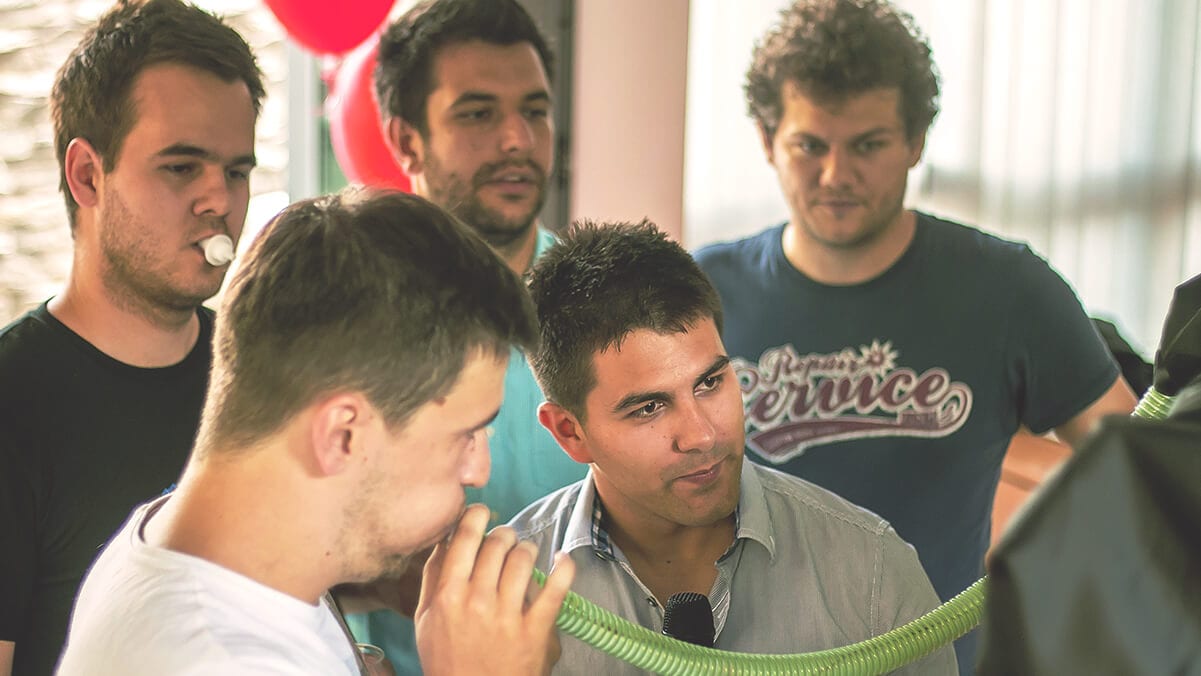
In our case, the wires that connected the MQ-3 were about 3 meters long because we needed the sensor to be on the end of a hose the user was supposed to blow into.
The second step was the data connection, or more precisely, getting the data from the sensor to some sort of database. We decided to use websockets.
And now it’s time to say hello to Cylon.js!
If you want to do something with Arduino and you know a little bit of JavaScript, this piece of software will really change your whole perspective.
It’s basically a piece of code that sits between the physical board and the Arduino interface, and it lets you communicate with all of your equipment through Node.js.
You can turn on an LED with JavaScript, you can use most of the existing node modules (e.g. socket.io) with it. Yes, it’s a little slow and sluggish, but it actually works!
And it doesn’t stop at the Arduino, they implemented interfaces for almost every known piece of IoT equipment there is.
It’s actually quite simple, but a little time-consuming. The first thing you need is to put a little more ‘disk space’ on your Arduino. This is done by purchasing and plugging in a micro SD card into the Arduino — it will act as its internal storage. Being that the default disk space on the Arduino is 8 megabytes, you can’t fit too many node modules on there (those 8 megabytes is ALL the disk space you get on it, not just for installing stuff).
The second step would be installing required node modules onto the Arduino. This has a little catch to it. Due to memory limitations of the Arduino (this time it’s RAM), npm install is not possible. The workaround for this is installing the desired module on a ‘normal’ computer using npm and then scp-ing it to the Arduino. This, of course, doesn’t install the dependencies of the modules, so this procedure is all about trial and error, but it works out fine.
For a complete guide on this, please refer to this article about expanding Arduino disk space.
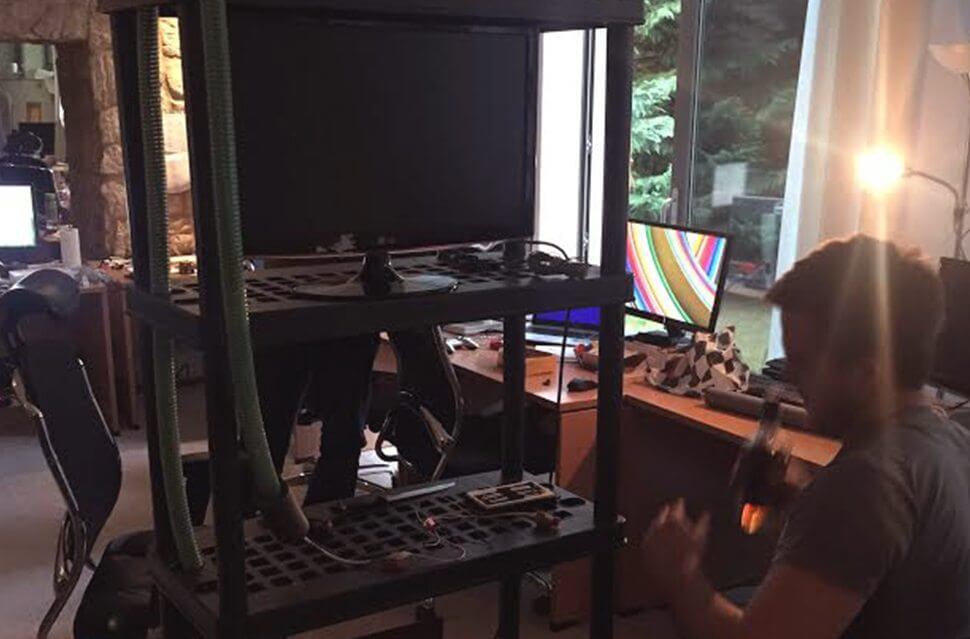
OK, the plan is simple. There will be a party, there will be drinks and there will be a vending-machine-like thing. People will see it and be delighted!
We needed a mechanism to detect the user — this was the main key of the process. Simple statistics without a country, team, name and picture-based information are lame.
In the world of IoT, it is always important to keep it simple. You’ve already got yourself into this whole mess, so don’t over complicate things because those things will stop working.
The first idea was a select box/mouse/keyboard combination, but since we wanted this ‘machine’ to be simple, and keep the needed steps/clicks/inputs to a bare minimum, we quickly decided this was not the way to go.
The second idea was to give NFC chips to everyone, preprogram their IDs into them (we have an employee database that is segmented into country, team and general info about a person), but that seemed problematic in real-life situations. What if someone other than an employee comes? What if someone breaks or loses their card?
Also, this is kind of expensive, takes a lot of time and in this scenario we needed a card reader. This idea was discarded because we wanted to keep the needed hardware to a minimum, just in case anything fails.
The third idea that came to mind were good old fashioned QR codes. We know nobody likes them, but hey, they work! We found a great JavaScript based QR reader, we had a few USB cameras lying around (so even if we encounter a failure, it’s not that hard to fix it), and if anyone needed an extra card, we could simply print it out. Since the IDs were the only things that had to be QRed, we needed just a simple three-digit number equal to a very simple QR code, so the reader doesn’t have to work that hard, and can deliver a detection BEEP faster.
We went with that and printed our very own personalized business cards with everyone’s QR code on them.
We wrote a little jQuery plugin, and every time a user detection was triggered, the QR reader sent the ID of that user to the plugin. This meant that a user is near the machine and is in need of entertainment. When the user is set, the process starts.
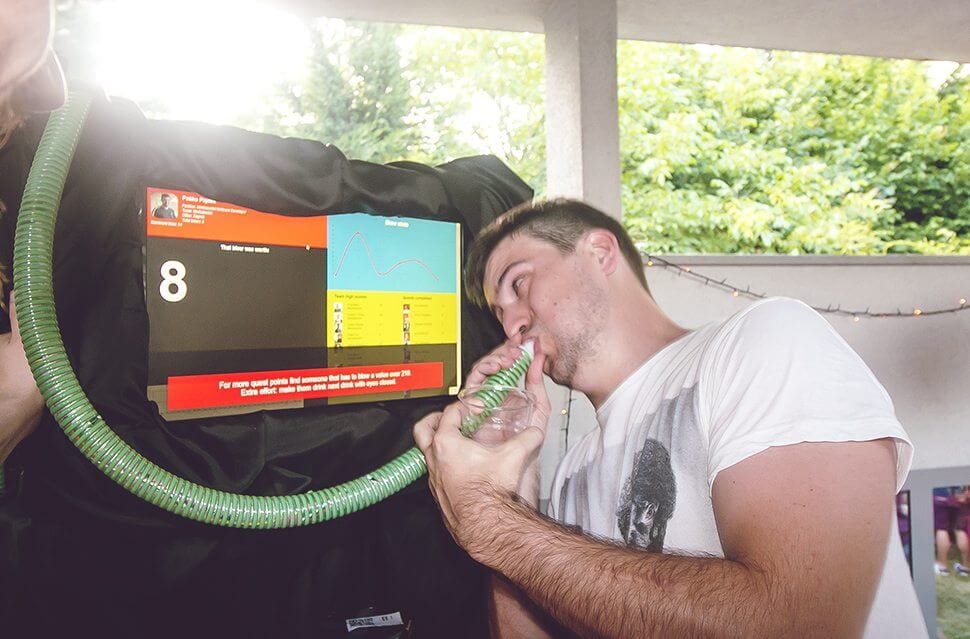
On the top of the machine, there was a big hose-like thingy to blow into and the alco-sensor was located about 10 cm inside that hose. When a user blew into the hose, the sensor sent the information to the Arduino. It then interpreted the signal as a number from 1 to 1000, depending on the amount of alcohol in your breath. Arduino sent that number to the jQuery socket we mentioned earlier by using cylon.js and socket.io.
The machine then detected the end of the blow, figured out a max value and saved the entry with a simple Ajax request to a database. We had a log of every blow, along with user IDs and time. After that, some data crunching gave us a very nice statistical overview showing the life of the party as the night progressed.
Of course, everything went smoothly and nothing went wrong, as it always goes with IoT projects because they are completely stable and risk-free. If our sarcasm sensor was working it would be lighting up right about now!
When we started this project, we were completely aware of what we’re getting ourselves into. This was something totally experimental, with hardware you can’t trust, and code that surely won’t be tested.
We were relying on a lot of parts that needed to fit and work together in perfect sync, and we are giving this to about one hundred people that were quite buzzed.
The whole time we were building the breathalyzer, it was always in a closed indoor space and during the night because we wanted to keep it a secret. We wanted to present it during a short party introduction speech by one of our CEOs. Before the party, we had a window of about half an hour to get it up and running, and so we did. Just a side note, this was done on one of the hottest days of the year.
After we set it up, we tested it thoroughly, managed to iron out the kinks, and tried it out about 100 times because we knew there was going to be an unveiling and it had to work. It had to work once, it had to work just that one time and it could completely fail afterward. We just needed it to work THAT ONE TIME! You get where this is going, right?
The party analysis machine was unveiled, but due to the heat, the camera of the QR reader decided it was time for a change and very ungracefully declined to cooperate.
We plugged it out and back in a couple of times and everything was back in order. People were drinking, using the thing (we got about 800 entries by the end of the party), but the one thing we didn’t think of was condensation. After some 200 blows, alcohol started to stick and got caught on the sides of the hose, and with the help of a few million degrees outside, it started to mess with the sensor itself.
In our test, the ‘zero’ (when no one was blowing into the tube) was about a sensor reading of 9. What we got in the middle of the party was a sensor reading of about 200, and that ultimately messed with the statistics themselves.
Despite everything, it was a pretty nice experiment about different kinds of data you can use to develop something that can be both entertaining and useful. We learned a lot about how this stuff works — especially the Arduino, sensor reading, QR reading, wiring and the Cylon.js.
This post is generally designed to motivate you to go out and play with stuff, but on the other hand, if you ever want to make this yourself (if you do please let us know) we are here to give you info about everything that went wrong.
In the future, we are surely going to experiment with other stuff like and probably get to a point where we could really connect everything to anything. And that’s mostly because this stuff is so much fun!